Bull Bear Momentum 🐮🐻
Overview💬
BBM provides 3️⃣ market information among the 9️⃣ major information.
The 3 market information as below :
✅ - Game Theory
【Bull Bear Momentum Indicator】
✅ - Demand & Supply
【Dt Smart Trend (MYTRIC)】 & 【Bull Bear Momentum Indicator】
✅ - Price Risk
【Dt Smart Trend (MYTRIC)】 & 【Bull Bear Momentum Indicator】
❌ - Overall Trend
【Dt Smart Trend (MYTRIC)】
❌ - Trend Phase
【Dt Smart Trend (MYTRIC)】
❌ - Banker Chips Trade (banker collect / banker disposed)
【Banker Chips Turnover & Divergence Index】
❌ - Chart Pattern Meaning
【coming soon】
❌ - Business Model
【we didn't provide】
❌ - Companies Financial Health
【Financial Intelligent Evaluation】
Full Introduction
What Market Information You Will Get 🔎
Bull Bear Momentum(BBM) indicator is a combination of leading + lagging indicator.
-
Leading Indicator are used to predict the next movement.
-
Lagging Indicator are used to show the current movement.
The main purpose of BBM is to measure the factors that affect the rise and fall of stock prices, and thereby increase confidence on your trading.
We use an unique algorithm to separate the movement of each candlestick in the market to calculate the individual momentums between buyer and seller.
By using BBM, you will be able to know whether the current market is leading by buyers or sellers, and know what is the current trend.
Below is the function of indicator:
1️⃣ The battle between buyers & sellers ⚔️
-
Momentum Balancing
【🟦 Buyer Leading The Market / 🟨 Seller Leading The Market】
2️⃣ Buyer & Seller active 🔥 or inactive
【🟩 Buyer active / 🟥 Seller active】
3️⃣ Buyer & Seller momentum strength 💪
-
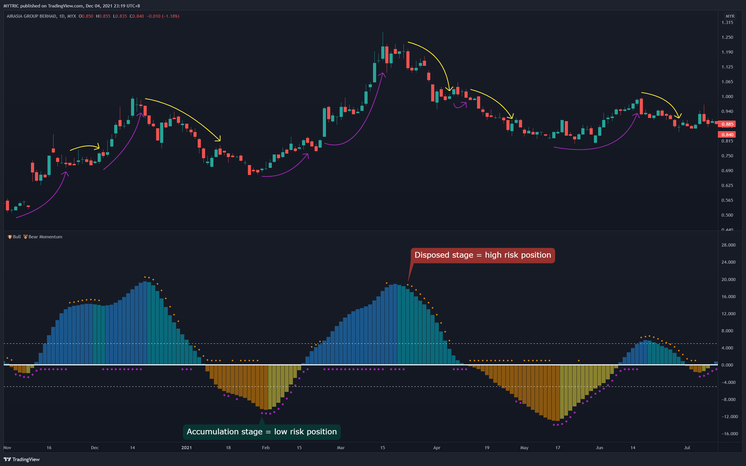
BBM has a value between -20 to +50 and is used to measure the strength of current trend.
-20 ~ -10 = Very Weak Momentum
-09 ~ -05 = Weak Momentum
-04 ~ +00 = Lower Neutral Momentum (Downward Sideway / Ranging Market)
+00 ~ +05 = Upper Neutral Momentum (Upward Sideway / Ranging Market)
+06 ~ +15 = Strong Momentum
+16 ~ +50 = Very Strong Momentum
4️⃣ A&D Oscillator / Price Risk Osc (Same as DT Smart Trend AD Osc)
Feature 1 - Momentum Balancing
The Battle Between Buyers & Sellers ⚔️
1️⃣ Momentum Balancing
-
Momentum balancing is measure combination of momentums between buyer and seller

Feature 2&3 - Buyer & Seller Momentum
Buyer & Seller / Bull & Bear Momentum🐮🐻
-
Analyze the momentums of the buyer and seller individually
1. Buyer Momentums🟩
-
🟩 Buyer Momentums Active 🔥
-
⬜ Buyer Momentums inactive
2. Seller Momentums🟥
-
🟥 Seller Momentums Active 🔥
-
⬜ Seller Momentums inactive

Feature 4 - A&D Oscillator / Price Risk
4️⃣ACCUMULATION & DISTRIBUTION OSC
-
To measure whether current price got any accumulation or distribution.

Case Study📚
*Length setting default as "10", this value determines the period of the algorithm.
The more common settings are 10 or 60.
Below settings are recommended for different trading style.
-
Short-term trader / Swing trader = 8 ~ 14
-
Mid-term trader = 20 ~ 60
-
Long-term trader = 60 and above
-
Example 01 (Downtrend) *
*We do not recommend trading in a downtrend, it is only suitable for swing trade or batch investment
Example 02 (Weak Trend)
Example 03 (Strong Trend)


Case Study of Divergence Analysis
Example 01
Example 02


How to Find Super Trend?
*Turn on 'Overall Buyer & Seller Trend'
1. Superbull (Potential Rate 95%) 🐮
-
When the Buyer's momentum more than 10 = Strong Trend 🟩; Seller's Momentum less than -5 = Weak Trend ⬜
-
The potential for stock prices to rise 📈 is very large, which is 95% and above, refer example below.
2. Superbear (Potential Rate 95%) 🐻
-
When the Seller's momentum more than 10 = Strong Trend 🟥; Buyer's Momentum less than 0 = Weak Trend ⬜
-
The potential for stock prices to fall 📉 is very large, which is 95% and above, refer example below.
Example 01 (Uptrend 📈)
Example 02 (Trend Cycle)
Example 03


